
Estimated Reading Time: 8–10 Minutes
Introduction: Every Government Promise Begins With Tax Revenue
Every year, governments announce ambitious plans. New highways are promised. Defence budgets are expanded. Railways receive fresh investment. Welfare programs are launched. Cities are modernized. New airports, ports, and power projects are unveiled. Yet behind every announcement lies a fundamental question that rarely receives the attention it deserves:
Where does the money come from?
Governments do not generate wealth in the same way businesses do. They do not manufacture products or sell services to generate most of their income. Instead, the primary source of government revenue comes from taxation. Taxes are the financial foundation of the modern state. They pay for national defence, public infrastructure, healthcare, education, welfare programs, scientific research, and the functioning of government itself. Without tax revenue, even the most ambitious policy vision would remain merely an idea. The tax collections recorded during FY 2025–26 therefore provide more than a snapshot of government finances. They offer a window into the health of India’s economy, the pace of formalization, consumer spending patterns, business profitability, and the effectiveness of tax administration. The numbers reveal a story that is larger than taxation itself. They reveal how the Indian economy is evolving.
Why Tax Collection Data Matters
Most people encounter tax only when filing income tax returns or paying GST while making purchases. However, economists view tax collection data as one of the most important indicators of economic activity. When tax collections rise, several possibilities emerge. Businesses may be earning higher profits. Consumers may be spending more. Employment levels may be improving. Compliance may be increasing. More economic activity may be moving into the formal sector.
In contrast, weak tax collections often indicate slowing economic activity, reduced profitability, or weaker consumer demand. This is why governments, investors, economists, and financial markets monitor tax revenue closely. Tax data often reveals changes in the economy before other indicators become visible.
India’s Tax Structure: Two Different Sources Of Revenue
To understand the significance of FY 2025–26 collections, it is necessary to understand how India’s tax system is organized. Broadly speaking, taxes fall into two categories.
Direct Taxes
Direct taxes are paid directly by individuals and businesses to the government.
These include:
- Personal Income Tax
- Corporate Tax
- Securities Transaction Tax
- Other direct taxes
The burden of a direct tax cannot easily be shifted to someone else. If a salaried employee pays income tax, the employee bears that burden directly. Similarly, when a corporation pays corporate tax, the liability rests with the company.
Indirect Taxes
Indirect taxes operate differently. These taxes are collected when goods and services are purchased. The most important example is GST. When consumers purchase products, they pay GST as part of the final price. Businesses collect the tax and remit it to the government. Indirect taxes therefore spread across millions of daily economic transactions. Together, direct and indirect taxes form the backbone of India’s revenue system.
FY 2025–26: A Strong Year For Tax Collections
The most striking feature of FY 2025–26 was the resilience of tax collections despite global uncertainty and domestic economic challenges. Official figures indicate that net direct tax collections reached approximately ₹23.4 lakh crore during the financial year.
| Indicator | FY 2025–26 |
| Net Direct Tax Collections | ₹23.40 lakh crore |
| Refunds Issued | ₹4.72 lakh crore |
| Gross Direct Tax Collections | ₹28.12 lakh crore |
These figures represent one of the strongest performances in India’s tax collection history. The significance becomes clearer when viewed in historical context. Only a decade ago, annual direct tax collections were significantly lower. The growth observed since then reflects both economic expansion and improvements in tax administration.
The Silent Transformation Of India’s Tax System
Perhaps the most important long-term development is not the size of collections but the changing nature of the tax base. Historically, India struggled with a narrow tax base. A relatively small proportion of the population filed income tax returns. Large portions of economic activity remained outside formal reporting systems. Cash transactions dominated many sectors.
Over the past decade, however, several developments have gradually changed this picture. The expansion of digital payments has created clearer transaction records. GST has improved reporting across supply chains. Increased digitization of tax administration has strengthened compliance mechanisms. Financial transactions increasingly leave electronic trails that are easier to monitor and verify. The result has been a gradual expansion of the formal economy. This transformation is often invisible to ordinary citizens, yet it has fundamentally altered the government’s revenue capacity. Today’s tax collections reflect not only economic growth but also a structural shift toward greater transparency and formalization.
Personal Income Tax: The Rising Pillar Of Revenue
One of the most notable developments in recent years has been the growing importance of personal income tax. For decades, corporate taxes were viewed as the dominant component of direct tax revenue. However, rising incomes, expanding employment in the formal sector, and improved compliance have steadily increased the contribution of individual taxpayers. This trend carries important implications. A broader personal tax base generally indicates:
- Rising formal employment.
- Higher declared incomes.
- Greater participation in the organized economy.
- Improved tax compliance.
In many ways, personal income tax collections serve as a measure of economic modernization. As India continues urbanizing and formalizing, the importance of personal income tax is likely to grow further.

DID YOU KNOW?
More than 10 crore Income Tax Returns (ITRs)
were filed for Assessment Year 2025–26,
highlighting the rapid growth of digital tax
compliance in India.
Corporate Taxes: What Businesses Reveal About The Economy
Corporate tax collections provide another valuable insight. Unlike income tax, which reflects household earnings, corporate taxes reflect business profitability. When companies generate higher profits, tax collections typically increase. Corporate tax performance therefore serves as a useful indicator of:
- Business confidence.
- Economic growth.
- Investment activity.
- Industrial performance.
The resilience of corporate tax collections during FY 2025–26 suggests that large segments of India’s corporate sector continued to perform reasonably well despite global uncertainty.
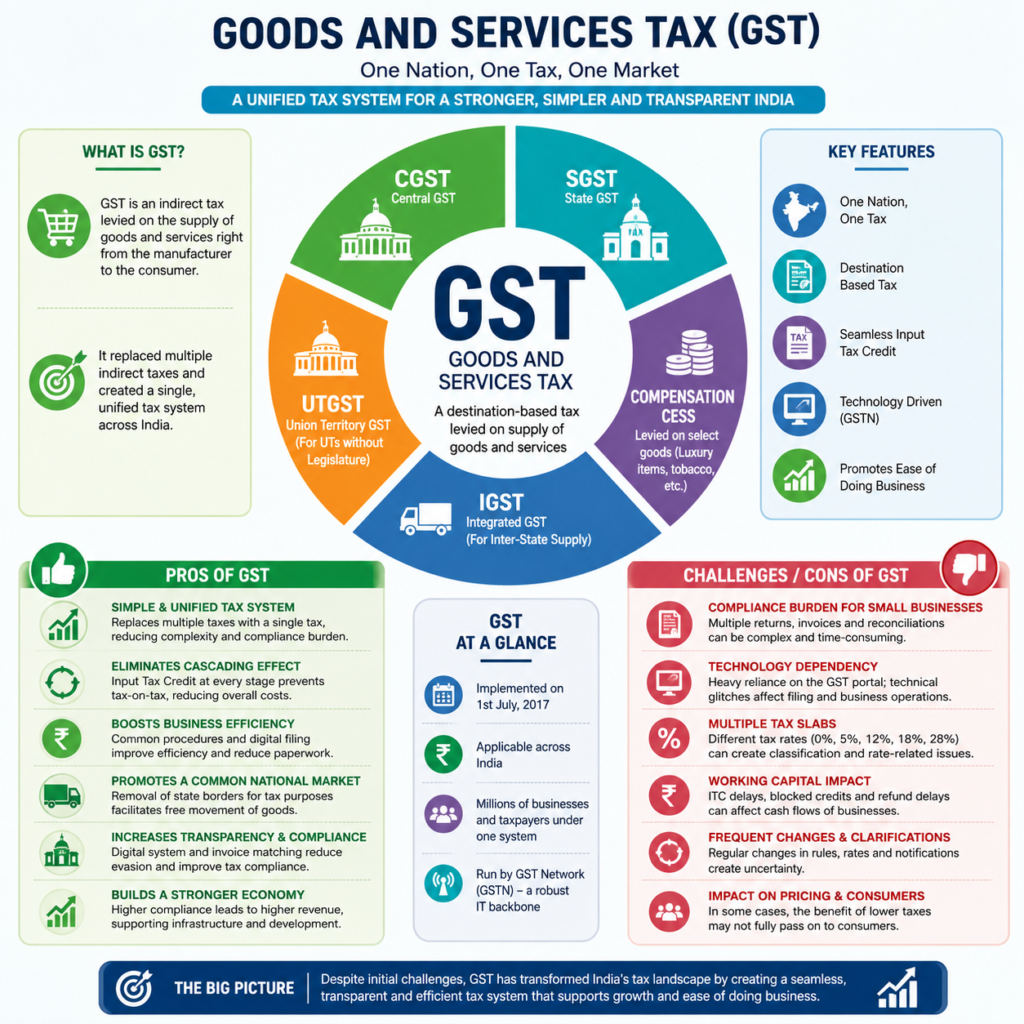
GST: The Tax Reform That Changed How India Collects Revenue
No discussion of India’s tax system is complete without understanding the Goods and Services Tax. Before GST was introduced in 2017, India’s indirect tax system was fragmented. Different states imposed different taxes. Businesses often had to navigate a complex web of VAT, excise duties, service taxes, entry taxes, and various local levies. Compliance was cumbersome, and inefficiencies increased the cost of doing business. GST fundamentally changed that structure.
Instead of a collection of disconnected taxes, India moved toward a unified nationwide tax framework. While implementation challenges certainly existed, GST has gradually evolved into one of the most important pillars of government revenue. During FY 2025–26, GST continued to demonstrate its growing maturity.
| Financial Year | Gross GST Collection | YOY Growth |
| FY 2020-21 | ₹11.37 lakh crore | -5.9% |
| FY 2021-22 | ₹14.88 lakh crore | +30.9% |
| FY 2022-23 | ₹18.07 lakh crore | +21.4% |
| FY 2023-24 | ₹20.18 lakh crore | +11.7% |
| FY 2024-25 | ₹22.08 lakh crore | +9.4% |
| FY 2025-26 | ₹22.27 lakh crore | +0.9% |
The significance of this figure extends beyond government finances. GST collections provide one of the clearest indicators of economic activity because they reflect transactions occurring throughout the economy. When consumers spend more, businesses sell more goods and services, generating higher GST collections.
Consequently, strong GST numbers often indicate healthy consumption and expanding economic activity.
What GST Reveals About The Economy
GST is sometimes described as an economic thermometer. Unlike many other economic indicators that rely on surveys or estimates, GST collections emerge directly from actual transactions occurring across millions of businesses. When GST collections consistently increase, several conclusions become possible: Consumer demand remains strong. Businesses are generating revenue. Economic activity is becoming more formalized. Compliance levels are improving. Digital reporting systems are functioning effectively.
This is one reason policymakers pay such close attention to monthly GST releases. The numbers often provide an early indication of economic momentum. The strong GST performance during FY 2025–26 suggests that India’s domestic economy remained resilient despite uncertainties in global markets.
Customs Duties: A Smaller But Strategic Revenue Source
While GST and direct taxes dominate revenue discussions, customs duties continue to play an important role. Customs duties are taxes imposed on imported goods entering India. These duties serve two purposes. The first is revenue generation. The second is economic policy. Governments frequently use customs duties to encourage domestic manufacturing, protect strategic industries, and influence trade patterns.
For example, higher duties on certain imports can make domestically produced alternatives more competitive. However, customs policy requires careful balancing. Excessively high duties can increase costs for consumers and businesses that depend on imported inputs. During FY 2025–26, customs duties continued contributing to government revenue while supporting broader industrial policy objectives such as Make in India and domestic manufacturing expansion.
Excise Duties And Fuel Taxes
Although GST replaced many indirect taxes, certain products remain outside the GST framework. Petroleum products are among the most significant examples. Fuel taxes therefore continue generating substantial government revenue through excise duties and related levies. Fuel taxation is often politically sensitive because it directly affects transportation costs and household budgets.
However, it also provides governments with an important and relatively stable revenue source. The challenge for policymakers is balancing revenue requirements against inflation concerns. When fuel taxes rise excessively, transportation and logistics costs can increase throughout the economy. When taxes are reduced, government revenues decline. Finding the appropriate balance remains an ongoing policy challenge.
20-year master table of total direct taxes, total indirect taxes, and total tax revenue generated by Government of India.
| Financial Year | Total Direct Taxes (₹ Cr) | Total InDirect Taxes (₹ Cr) | Total Tax Revenue (₹ Cr) |
| 2005-06 | 1,65,216 | 1,98,767 | 3,63,983 |
| 2006-07 | 2,30,181 | 2,40,876 | 4,71,057 |
| 2007-08 | 3,12,213 | 2,76,696 | 5,88,909 |
| 2008-09 | 3,33,818 | 2,64,565 | 5,98,383 |
| 2009-10 | 3,78,063 | 2,45,367 | 6,23,430 |
| 2010-11 | 4,46,935 | 3,45,127 | 7,92,062 |
| 2011-12 | 4,93,946 | 3,92,444 | 8,86,390 |
| 2012-13 | 5,58,596 | 4,74,482 | 10,33,078 |
| 2013-14 | 6,38,596 | 4,97,060 | 11,35,656 |
| 2014-15 | 6,95,792 | 5,44,772 | 12,40,564 |
| 2015-16 | 7,42,012 | 5,46,000 | 12,88,000 |
| 2016-17 | 8,49,818 | 8,63,000 | 17,13,000 |
| 2017-18 | 10,02,738 | 9,13,000 | 19,16,000 |
| 2018-19 | 11,37,718 | 11,37,000 | 22,75,000 |
| 2019-20 | 10,50,678 | 10,98,000 | 21,49,000 |
| 2020-21 | 9,45,000 | 10,71,000 | 20,16,000 |
| 2021-22 | 14,09,110 | 12,89,662 | 26,98,772 |
| 2022-23 | 16,61,428 | 13,81,934 | 30,43,362 |
| 2023-24 | 19,58,286 | 14,95,853 | 34,54,139 |
| 2024-25 | 22,37,000 | 16,20,000 | 38,57,000 |
| 2025-26 | 23,40,000 | 16,80,000 | 40,20,000 |
Direct-tax figures come from the Department of Revenue direct-tax series; indirect-tax figures come from the Department of Revenue indirect-tax series.
Direct Taxes
│
├── Corporate Tax
│
├── Personal Income Tax
│
├── Securities Transaction Tax (STT)
│
└── Other Direct Taxes
Indirect Taxes
│
├── GST
│ ├── CGST
│ ├── SGST
│ ├── IGST
│ └── Compensation Cess
│
├── Customs Duty
│
├── Excise Duty
│
└── Other Minor Levies
Over the last two decades, India’s total tax revenue has expanded from roughly ₹3.6 lakh crore in FY 2005–06 to more than ₹40.2 lakh crore by FY 2025–26. This represents one of the most significant fiscal transformations in the country’s history. The composition of revenue has also changed dramatically. In the early 2000s, customs duties and excise taxes dominated collections. Today, direct taxes and GST form the backbone of government revenue. The shift reflects rising incomes, greater formalisation, digital compliance, and the expansion of the organised economy. Tax data therefore tells a broader story than government finances alone—it tells the story of India’s economic transformation.